Lesson 6: Applications of Equations in Factored Form

Now that we have acquired all the necessary skills required to solve questions having to do with quadratic equations in factored form, it is time to apply our skills with a few practice questions.

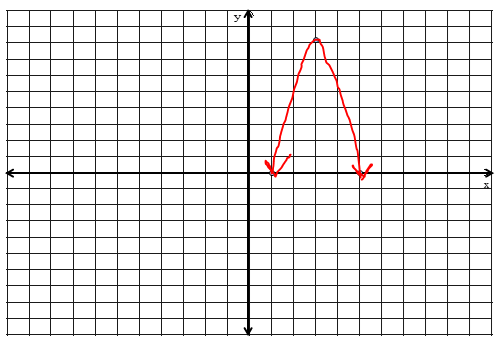
1. The hop of a frog can be modeled with the equation h=-2(d-1)(d-5), where d is the horizontal distance (in meters) from a log, and h is the height (in meters), from the ground. Create a graph which models the hop of the frog.

*Units represent 1m each.

2. How far from the log is the frog when it lands on the ground?

Answer: 5m, since it is when the height is 0m, after the frog has jumped.

3. What is the maximum height of the frog, and how far, horizontally, is it from the log at that moment?

Answer: The maximum height of the frog is 8m and the horizontal distance from the wall (at that moment) is 3m.

Angelina and Jennifer are next-door neighbours. Their backyards share a common fence which bisects both backyards. Angelina lives on the left side, and Jennifer lives on the right side. From her backyard, Angelina kicks a soccer ball into Jennifer’s backyard, while standing 4m away from the fence. The ball reaches a maximum height of 7m and lands 2m away from the fence in Jennifer’s backyard.

1. Determine an equation to represent the path of the soccer ball, assuming that the fence separating the girls’ backyards passes through the origin.

Answer:

y=a(x+4)(x-2)

x= (-4+2)/2

x= -2/2

x= -1

7=a(-1+4)(-1-2)

7=a(3)(-3)

7/(-9)=(-9a)/(-9)

-7/9=a

Therefore the equation which represents the flight of the soccer ball is y=-7/9(x+4)(x-2)


Lesson 5: Quadratic Relations in Factored Form

Another form in which quadratic relations can be expressed is factored form, y=a(x-r)(x-s), where a is still the dilatation factor, and r and s are x-intercepts (called zeros). In order to find the vertex when given a quadratic relation in factored form, add both x-intercepts together (keeping in mind that the signs of the x-intercepts are the opposite of what is actually indicated- like the h value in vertex form), and then dividing them by the number of x-intercepts (2). Or, in other words, by finding the average of the 2 x-intercepts because the x-coordinate of the vertex is located on the axis of symmetry- going through the mid-point connected the zeros. Next, when you have found the x-value of your vertex, you simply substitute into the equation (in place of both x values) and solve for y, which will give you the k or y value of the vertex. Now, using the zeros and the vertex, we can plot the parabola.

For example, if we have the equation y=(x+1)(x-5), we would be able to pick out the fact that the zeros are -1 and 5.

To find the h or x value of the vertex, we will find the average of the zeros and substitute the value into the equation, and solve for y.

h= (-1+5)/2

h=4/2

= 2

y=(2+1)(2-5)

y=(3)(-3)

y=-9

Therefore, the vertex of the equation is (2,-9).

The graph of the equation would look something like this:

*Scale increases by scale of 1 unit

Now, what if you are given a graph and expected to make an equation in factored form, from only the information given? Again, although this sounds difficult, it isn’t. To ensure the best possible understanding of the concept, let’s use an example.

The SoParabolic bridge in New Zealand is 110m wide and 110m tall. Assuming that the bridge is symmetrical about the y-axis, draw a graph to represent the bridge.

Since the bridge is 110m in total width, and is symmetrical about the y-axis, it must be 55m wide on either side of the vertex. Also, with this information, we now know that the coordinates of the zeros of the bridge are (55,0) and (-55,0), whereas the vertex is (0,110).

*Each unit represents 10m.

Determine an equation to model this bridge.

Since we now have our zeros and our vertex, we can substitute these values into our factored form equation, and solve for a.

100=a(0-50)(0+50)

100=a(-50)(50)

100/(-2500)=(a(-2500))/(-2500)

-0.04=a

Therefore the equation that models the bridge is y=-0.04(x-50)(x+50), where x is the horizontal length, and y is the height.

Parabolic Note: The same method can be used if just the graph is given. Find the x-intercepts, find the average of the zeros to find the x-value of the vertex, and then solve for y and a.

*****

On some occasions, you might encounter an equation which looks like this, y=(x-5)(2x+4). In this case, you simply divide the 2 by the 4, to get y=(x-5)(x+2). Remember, you cannot plot the graph until the x-values are on their own.


Lesson 4: Applications of Vertex Form

Now that we have learned all the skills necessary to understand equations and graphs in the vertex form of a quadratic relation, it is time to begin applying our skills.

*In order to view answers, highlight “Answer:”.

Fireworks are generally associated with quadratic equations because they tend to fly in a parabola. The application question which we will be solving will involve fireworks because they constitute a real-life situation.

1. You are a pyrotechnician. You have just launched a firework which can be modeled by the equation h=-1.2(t-7)^2+170, where h is the height of the firework in meters, and t is the time, in seconds.What is the vertex in this situation, and what does it represent?

Answer: The vertex is (7,170) and it represents the maximum height (170m) the firework reached after 7 seconds.

2. What was the initial height of the firework?

Answer:

h=-1.2(t-7)^2+170

h=-1.2(0-7)^2+170

h=-1.2(-7)^2+170

h=-1.2(49)+170

h=111.2

Therefore the initial height of the rocket was 111.2m, when the time was 0 seconds.

3. Oh no! Your second firework, with the equation h=-2(t-9)^2+200 was a dud! What time did it end up hitting the ground?

Answer:

h=-2(t-9)^2+200

0=-2(t-9)^2+200

0-200=-2(t-9)^2

(-200)/-2=(-2(t-9)^2)/-2

(100)^1/2=((t-9)^2)^1/2

10=t-9

10+9=t

19=t

Therefore the firework landed after 19 seconds.

Now to analyze a graph.

Danny wants to build a bridge for his ants to climb on. Since ants are tiny, Danny’s bridge is not very large, and can be modeled by the equation y=-2x^2+8 (where y is the height above the bottom of the cage and x is the horizontal distance), and the graph shown below.

*Each unit represents 1cm

1. What is the total length of Danny’s bridge?

Answer: 4cm

2. How tall is Danny’s bridge?

Answer: 8cm

3. If Danny wanted to reduce the height of his bridge to 5cm, what would the new equation be?

Answer: y=-2x^2+5

4. If Danny wanted to create a plank (flat board) instead of a bridge. what would be the equation of the structure?

Answer: y=0


Lesson 3: Graphing and Solving Vertex Form

When given the equation of a quadratic equation in vertex form and told to graph it, more than one method can be used to do this. The first method is the 4-step process. The 4-step process involves the following steps:

  1. Graph the base parabola
  2. Apply the vertical dilation (vertical stretch or compression factor, a) to the base parabola, as a new parabola on the same graph
  3. Apply the vertical translation to the previous parabola
  4. Apply the horizontal translation to the previous parabola

Parabolic Note: Steps 3 and 4 can be done in any order

*****

After completing this process, you should have 4 different parabolas, one of which is your final parabola.

For example, if we were to graph the equation y=-2(x+3)^2-2, it would look something like this:

Red represents: y=x^2

Blue represents: y=-2x^2

Black represents: y=-2x^2-2

Green represents: y=-2(x+3)^2-2

*Scale increases by units of 1

Another, simpler method one can use to graph a parabola in vertex form is the 1-step process, which is:

  1. Plot your vertex
  2. Multiply the step pattern of the base parabola (1,3,5,7) by the a value of the equation, and apply it to the parabola

For example, if we were to graph the equation y=2(x+2)^2-4, it would look like this:

*Scale increases by units of 1

In your grade 10 math career, there may be times when you are given the vertex of a parabola and a point on the parabola (you are either told this, or it is given to you on a graph), and you must determine the equation of the parabola (in vertex form)- in order to graph it. Although this sounds a bit complicated, it is actually quite simple, as you have been given all the information needed to solve the question.

For example, take the graph given above. If we weren’t already given the equation, and were told to find an equation given the vertex (-2,-4) and a point (-1,-2), we would first plug these values into our vertex equation, like so.

y=a(x-h)^2+k

-2=a(-1+2)^2-4

Now, we only have to solve for one variable, a.

Following the rules of BEDMAS, let’s solve what is in the brackets first.

-2=a(1)^2-4

-2=a-4

Now we isolate the variable.

-2+4=a

2=a

Now that we have solved for a, we can create our equation:

y=2(x+2)^2-4

As you can see, as long as we are given the vertex and a point on a parabola (with or without a graph), we can always find the equation.

However, what if we are told to find the equation of a parabola when given a vertex and some translations? Well, we simply apply the skills we learned in the previous lesson, about transformations.

For example, if we are given the vertex (2,5) and are given these translations:

  • Vertical stretch by factor of 2
  • Reflected on x-axis
  • Horizontally translated 4 units to the right
  • Vertically translated 2 units down

We would start by modelling the information we do have.

y=a(x-2)^2+5

Now we take the translations, analyze them and what they mean, and plug them into the equation.

A vertical stretch by a factor of 2 means the a value is being affected. The word “stretch” means that the parabola will become narrower, so the a value has to be greater than 1, in this case, it is 2.

y=2(x-2)^2+5

If the graph is reflected on the x-axis, it means that the parabola will go from opening upward, to opening downward- making the a value negative.

y=-2(x-2)^2+5

Since the graph is horizontally translated 5 units to the right, we add 5 to 2, and change the h value to reflect this.

y=-2(x-7)+5

Finally, since the graph is vertically translated 4 units down, we subtract this from the k value, and change the k value to reflect this.

y=-2(x-7)+1

We now have our new equation.

Lesson 2: Transformations of Quadratics in Vertex Form

Although the standard form of a quadratic relation was introduced to you in the previous lesson, we are now going to be looking at another equation which models a quadratic relation, vertex form. With the vertex form of a quadratic relation, determining things like the vertex of the parabola, the axis of symmetry, whether the parabola will open upwards or downwards, and whether the vertex will be maximum or minimum value is very simple, and can done by simply looking at the equation.

Vertex form: y=a(x-h)^2+k

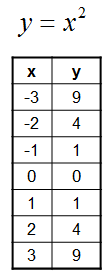
All parabolas are the result of various transformations being applied to a base or “mother” parabola. This base parabola has the formula y=x^2, and represents what a parabola looks like without any transformations being applied to it. The table of values for a base parabola  look like this:


The reason this small equation forms a parabola, is because it still has the degree 2, something discussed in the previous lesson. In order to verify this, however, we can find the second differences of the table of values.


Now that we know about the base parabola, we can discuss the transformations which the various values in the vertex form of an equation apply.

The first value of in the vertex equation, a, gives us two pieces of information.

  • If the absolute value of a is less than one (a decimal or fractional number), the base parabola is vertically compressed (made wider and flatter) by a factor of a
  • If the abolsute value of a is one or more, the base parabola is vertically stretched (made longer and narrower) by a factor of a
  • If the value of a is negative, the parabola will open downwards (the parabola will frown), and the vertex will have a maximum value
  • If the value of a is positive, the parabola will open upwards (the parabola will smile), and the vertex will have a minimum volume


The next value, h, translates the base parabola horizontally h units. However, there is a key piece of information to remember when plotting the h value. If the value of h is subtracted from x in the equation, it is plotted on the right (positive) x-axis. On the other hand, if the value of h is added to x in the equation, it is plotted on the left (negative) x-axis.

Parabolic note: The reason the h value is the “opposite” of what it claims to be can be displayed by setting the expression with the h value (excluding the exponent) equal to zero, and solving for x.

For example, if we have the equation: y=(x-2)^2, we would do this:

x-2=0

x=2

As you can see, the real value of h is 2.

*****

The general rule which comes into play while looking at the h value in the vertex form of a quadratic relation is:

  • If h>0, the base parabola is translated (horizontally) h units to the right
  • If h<0, the base parabola is translated (horizontally) h units to the left


Finally, the k value of the equation translates the base parabola vertically k units. If the value of k is -4, then the base parabola is shifted to the point -4 on the y-axis. If the value of k is 4, then the base parabola is shifted to the point 4 on the y-axis.

The general rule for plotting the k value of an equation in vertex form is:

  • If k>0, translate the base parabola k units upward
  • If k<0, translate the base parabola k units downward


As mentioned before, the vertex form of a quadratic relation also gives us the vertex of the parabola, which is: V=(h,k).

For example, if we had the equation: 2(x-3)^2+5, the vertex of the parabola would be (3,5).

The vertex form of a quadratic relation can also give us the axis of symmetry of the equation, which is equal to the h value of the equation.

In the equation given above, the axis of symmetry would be x=3

Something else which is very important when it comes to the vertex form of the equation is the step pattern of the parabola- the rise and run from one point to the next. The step pattern of the parabola can be determined by finding the first differences for the y-values. The base parabola has a step pattern of 1,2,5,7 (the step pattern can never be negative). Since every other parabola is created by applying transformations to the base parabola, the step pattern of any other parabola can be found by multiplying the a value of the equation by the step pattern of the base parabola.

Again, for the equation above, for which the a value is 2, we can determine the step pattern of the parabola, which is 2, 4, 10, 14.


Lesson 1: Quadratic Relations

Distinguishing between linear equations and a quadratic equations can easily be done by noting the degree of the equation given. By definition, a quadratic relation is a second degree equation, whereas a linear relation is a first degree equation. In general, the equations of quadratic equations can be found in standard form: y=ax^2+bx+c, where a, b, and c are all real numbers, and a is a number that is not 0.

Parabolic Note: Although there are quite a few distinctions between linear equations and quadratic equations, many people seem to confuse the standard form of a line and the standard form of a quadratic relation:

Standard form of line: ax+by+c=0

Standard form of quadratic relation: y=ax^2+bx+c

The main difference here is, as mentioned before, the degree(s) of the two equations. The equation of a quadratic relation will always be a second degree equation.

*****

The graph formed by plotting the points of a quadratic relation is called a parabola. A parabola is a U-shaped curve which has certain characteristics:


  • A parabola is always symmetrical, it is divided in congruent halves by an axis of symmetry
  • The vertex of the parabola is the point at which the curve changes direction (downwards to upwards or upwards to downwards)
  • If one were to draw a line through the vertex of a parabola, one would have the axis of symmetry
  • The vertex can either be classified as a maximum or a minimum
  • The vertex is a maximum if the parabola opens downward, because it is the highest point the parabola touches (it can extend forever downwards)
  • The vertex is a minimum if the parabola opens upward, because it is the lowest point the parabola touches

Although the fact that all quadratic relations are second degree equations is an excellent way to tell whether a function is quadratic or not, there are times when we are not given an equation to look at. Instead, what we are given is a table of values, some for x, and the respective values for y. In this case, we first look at the x-values in the table. If the x-values are constant (increasing/decreasing by the same amount), then we can move on to the y-values. If the y-values of the table are constant (subtracting consecutive y-values from one another), we can conclude that the relation between the x and y-values is linear– this is called finding the first or finite differences. If, through this method, one finds that the y-values are not constant, we proceed to subtract the first differences from one another. If the new values are constant, we can conclude that the relation between the x and y-values  is quadratic- this is called finding the second or finite differences.

Summary of lesson:

  • A quadratic relation is a second degree equation, usually found in standard form: y=ax^2+bx+c
  • When graphed, a quadratic equation forms a parabola which either opens upwards or downwards, and is symmetrical
  • The vertex of a parabola can either be a maximum or a minimum, depending on the direction of its opening
  • The axis of symmetry divides a parabola into two congruent parts
  • In quadratic relations, the second differences are constant (in a table of values)-if the x-values are constant

Exchanging pleasantries…

As a technology student who enjoys math, I find that I’ve never been very good at exchanging pleasantries. There always seems to be some sort of divide which places itself between me and the person I am speaking to. Quite often, this renders me helpless whenever I need to ask for some sort of assistance in any of my classes, because I simply don’t know how to ask. Where does this leave me, you ask? It leaves me with the internet. Many of the concepts I now practice in math are things I have taught myself, using online resources, eons before I was even supposed to know of their existence. Now, of course this method occasionally led to confusion, but the confusion was never long-lasting, and learning the material beforehand only enhanced my overall grasp on the material afterward.

Now, although the rewards one is able to reap from this method abound, the road to success is more than a little bumpy, mainly because conventional search engines do not provide the best resources for math lessons. In fact, I would have to cross-check my information so many times that I would begin to doubt everything. Finally, I’d come across one or two websites that provided me with the information I needed, and I was very thankful for them.

Similarly, I want other to be able to learn math concepts in advance, and know that whatever they are learning, is correct. I want others to learn the short-cuts and methods which make both math and life easier. I want others to understand the world that is mathematics, without confusion and hatred.

Now, mathematics is a topic which can be branched into copious sub-categories, and for this reason, I am going to focus on the one branch that opens up a whole other worlds of mathematics: Quadratic Relations.

The goal is to cover all the topics in a standard “Introduction to Quadratics”, in a way which is not only easy to understand, but enjoyable as well.

So, without further adieu, let us begin our endeavour.

*Note, when looking at answers to questions, please highlight blank area around “Answer:”.